| |
CFD Grid Editor
|
 |
View Menu |
| |
|
Introduction |
| |
|
The function view alters the appearance of the grid presentation without altering its properties. Therefore this menu is helpful for giving a better look to the grid and to help the visualization. In Figures 44, 45 and 46 follow the menu visualize with its functions and sub-functions.
|
| |
|
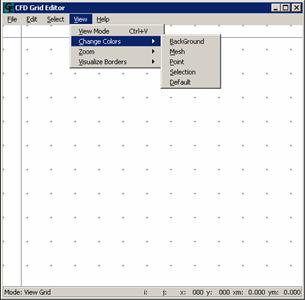
Figure 44
|
| |
|
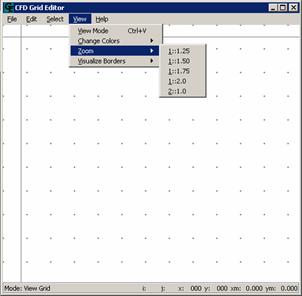 Figure 45
|
| |
|
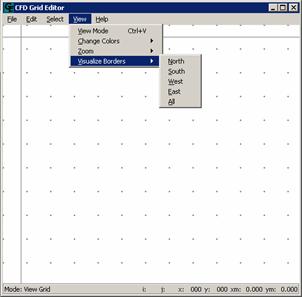 Figure 46
|
| |
|
View Modes |
| |
|
PATH: On the VIEW menu, click VIEW MODE.
This function changes the grid visualization without changing its properties and without changing the coordinate points related to the coordinate axes. When selecting the visualization mode, several actions can be done starting from the mouse.
|
| |
|
Moving the Grid |
| |
|
Maintaining the left button of the mouse pressed on the Grid Editor screen, you can drag the grid to other place. In the Figures 47 and 48 we can see an example of a grid being dragged.
|
| |
|
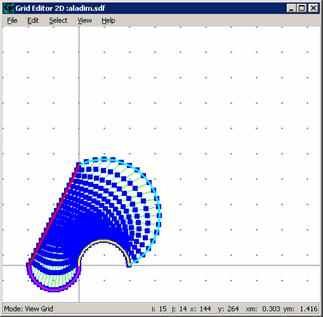 Figure 47
|
| |
|
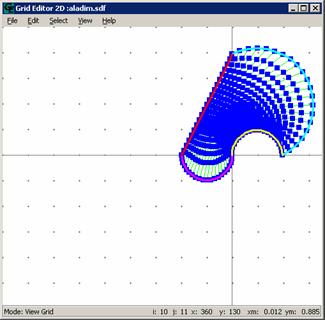 Figura 48
|
| |
|
Zoom In |
| |
|
To increase the zoom of the grid, click twice with the left button of the mouse on the Grid Editor screen. This process can be repeated until the user judge the zoom is OK.
In Figures 49 and 50 follows an example of a grid before and after the Zoom in.
|
| |
|
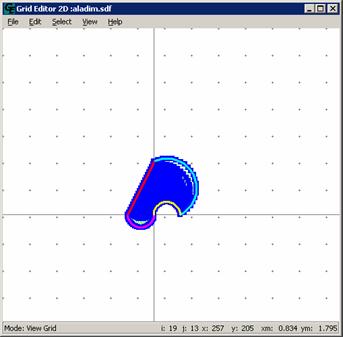 Figure 49
|
| |
|
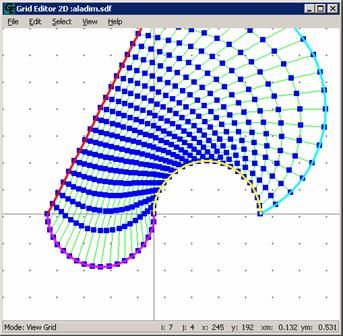 Figure 50
|
| |
|
Notice that the position of the coordinated origin axes stays in the same point of the screen, and it is starting from there that the zoom is made.
|
| |
|
Zoom out |
| |
|
To decrease the zoom of the grid, click twice with the right button of the mouse on the Grid Editor screen. Notice that the position of the origin of the axes stays in the same point of the screen, and it is starting from there that the zoom is processed.
|
| |
|
Changing Screen Colors |
| |
|
PATH: On the VIEW menu, click CHANGE COLORS.
The Grid Editor 2D offers the option of changing colors of screen elements: BACKGROUND, GRID, POINT and SELECT. Following the indicated path a screen like in Figure 51 will appear. In this window, you could notice that the MODE, in the left bottom of the screen changed VIEW GRID mode.
|
| |
|
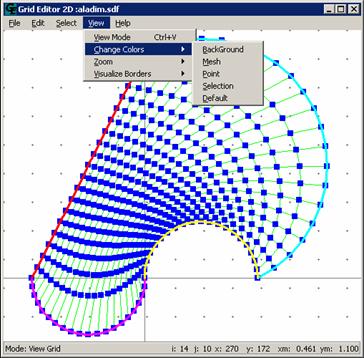 Figure 51
|
| |
|
How to Change Background Color |
| |
|
PATH: On the VIEW menu, click CHANGE COLORS.
Following the path a screen like Fig. 52 will show up. In that window, there are two forms of altering the background color: first, just click on top of the desired color and click in OK. The other one is to adjusts the tonality of each color individually, entering in each field with the specific value.
|
| |
|
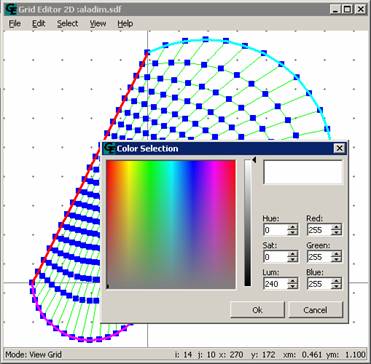 Figure 52
|
| |
|
How to Change the Grid Line Color |
| |
|
PATH: On the VIEW menu, click CHANGE COLORS and MESH option.
Follow the same step as before.
|
| |
|
How to Change Grid Points Color |
| |
|
PATH: On the VIEW menu, click CHANGE COLORS, and POINT option.
Follow the same steps as before.
|
| |
|
How to Change the color of the Selected Elements |
| |
|
PATH: ON the VIEW menu, click CHANGE COLORS, and SELECTION options.
Grid Editor 2D offer the option of changing the color of the selected elements. Following the PATH a window like the others will appear, so you can select a color as you selected the items before.
|
| |
|
How to Come Back to the Initial Configuration (Default) |
| |
|
PATH: On the VIEW menu, click CHANGE COLORS, and DEFAULT option.
The Grid Editor 2D has a default configuration for background, grid, points and selection colors. So you can undo the alterations on those elements and return to the default configuration, clicking in DEFAULT.
|
| |
|
How to Change Visualization Size |
| |
|
PATH: On the VIEW menu, click ZOOM.
Grid Editor 2D offer the option to change the visualization size visualization on screen, as in Figure 53.
|
| |
|
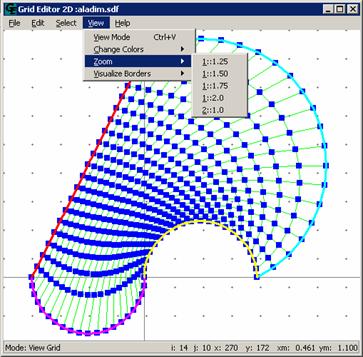 Figure 53
|
| |
|
There are five different options for Definition of the Zoom, as you can see in Figure 53:
OPTION 01: (1:1.25) in that option, each element of the screen will be visualized with its size multiplied by 1.25, that means, it will be increased quarter of its initial visualization.
OPTION 02: (1:1.50) Size multiplied by 1.50.
OPTION 03: (1:1.75) Size multiplied by 1.75.
OPTION 04: (1:2.0) Size multiplied by 2.0. A short cut clicking in the left button of the mouse exists for this soption.
OPTION 05: (2:1.0) in that option, each element of the screen will be visualized with its size multiplied by 0.5. A short cut is obtained clicking with the right button of the mouse.
|
| |
|
Visualizing Geometry Borders |
| |
|
PATH: On the VIEW menu, click VISUALIZE BORDERS.
Using boundary-fitted coordinates it is not always easy to identify which boundary is the north, south, east or west. Because of this the geometry border visualization was created. In Figure 55 an example of the visualization of the NORTH BORDER (in red) can be seen.
|
| |
|
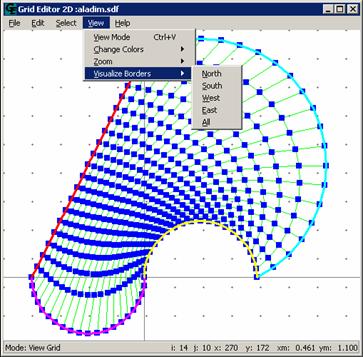 Figure 54
|
| |
|
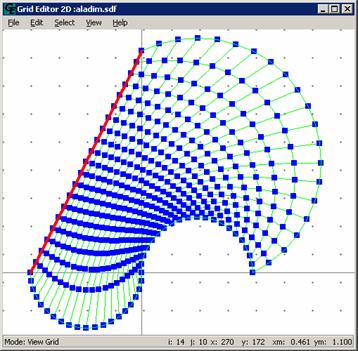
Figure 55
|